Monitoring Redis

Redis is great for caching, storing session data, and backing queues. However, Redis running out of memory can cause your application to crash. In this brief guide, we'll use Python and AnomalyAlert to monitor free memory and various other metrics on Heroku Redis, and deploy to Heroku. This approach can be adapted to monitor any Redis instance.
Collecting metrics
We'll keep an eye on the following metrics:
- Free memory
- Number of active connections
- Cache hit ratio
This should provide us with a good overview of our instance's health. Let's create a new directory for our project:
mkdir redis-monitor
cd redis-monitor
Next, create a requirements.txt file listing our dependencies (a Redis client and the requests library):
redis==5.0.0
requests==2.31.0
Now, on to the script that collects metrics and sends them to AnomalyAlert. Let's call it redis-monitor.py.
import redis
import requests
import os

# Get Redis server URL from environment variable
redis_url = os.environ.get('REDIS_URL')

# Get AnomalyAlert API key from environment variable
api_key = os.environ.get('ANOMALYALERT_API_KEY')

# Get monitor name from environment variable
monitor = os.environ.get('ANOMALYALERT_MONITOR')

connection_pool = redis.ConnectionPool.from_url(redis_url, ssl_cert_reqs=None)
r = redis.Redis(connection_pool=connection_pool)

# Get server info
info = r.info()

# Connected clients
connected_clients = info.get('connected_clients')

# Calculate free memory (megabytes)
free_memory = info.get("maxmemory", 0) - info.get("used_memory", 0)
free_memory_mb = round(free_memory / (1024 * 1024), 2)

# Calculate cache hit rate
keyspace_hits = info.get('keyspace_hits', 1)
keyspace_misses = info.get('keyspace_misses', 0)
cache_hit_rate = round(keyspace_hits / (keyspace_hits + keyspace_misses), 2)

data = {
  'api_key': api_key,
  'monitor': monitor,
  'data': {
    'clients': connected_clients,
    'free_memory': free_memory_mb,
    'cache_hit_rate': cache_hit_rate
  }
}

headers = {"Content-type": "application/json"}
requests.post("https://io.anomalyalert.com/", json=data, headers=headers)
print(f"Clients: {connected_clients}, Free memory: {free_memory_mb}MB, Cache hit rate: {cache_hit_rate}")
Deploying to Heroku
Note: This step is relevant only if you are going to use Heroku.
We'll need Heroku CLI installed in order to deploy, so if you don't have it yet, go ahead and install it.
Let's initialize a Git repository and commit the two files we created:
git init
git add .
git commit -m 'Initial Redis monitor'
With Git repo in place, we can create a new Heroku app:
heroku create <name of your new heroku app>Then, we'll set the required environment variables:
heroku config:set REDIS_URL=... ANOMALYALERT_MONITOR=redis ANOMALYALERT_API_KEY=... You can grab your AnomalyAlert API key from the AnomalyAlert settings screen. Change the value of ANOMALYALERT_MONITOR to something more descriptive if you feel like it.
Time to deploy to Heroku:
git push heroku mainOnce deployed, we can use Heroku's Scheduler to run our script periodically. Head over to the Heroku dashboard, locate your newly created monitor app, and add the free Heroku Scheduler add-on.
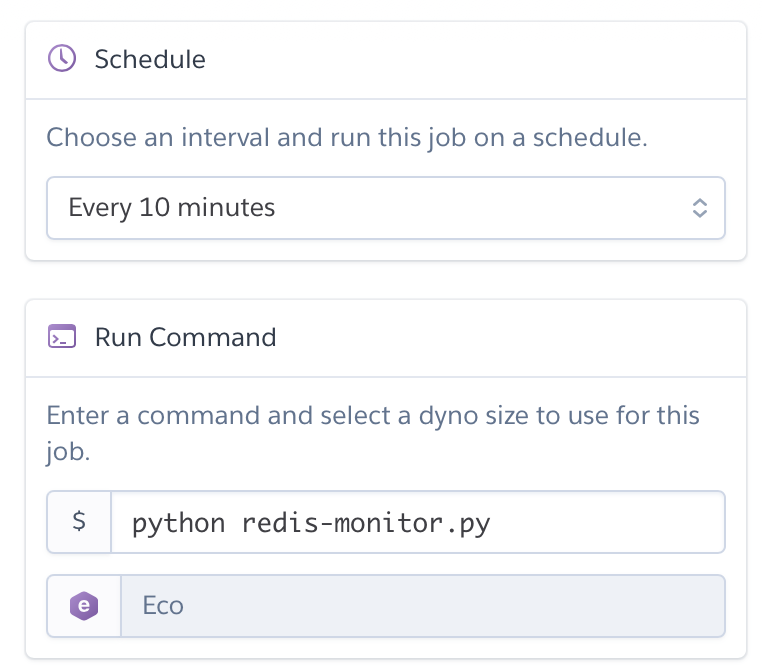
Create a new job that runs every 10 minutes and specify python redis-monitor.py as the command.

That's it! Now we'll receive updated stats approximately every 10 minutes. Since we're impatient (but also need to verify that our script actually works), we'll run this first one by hand:
heroku run python redis-monitor.pyIf everything went well, you should see your Redis stats appear both in your terminal as well as on the AnomalyAlert dashboard.

Configuring alerts
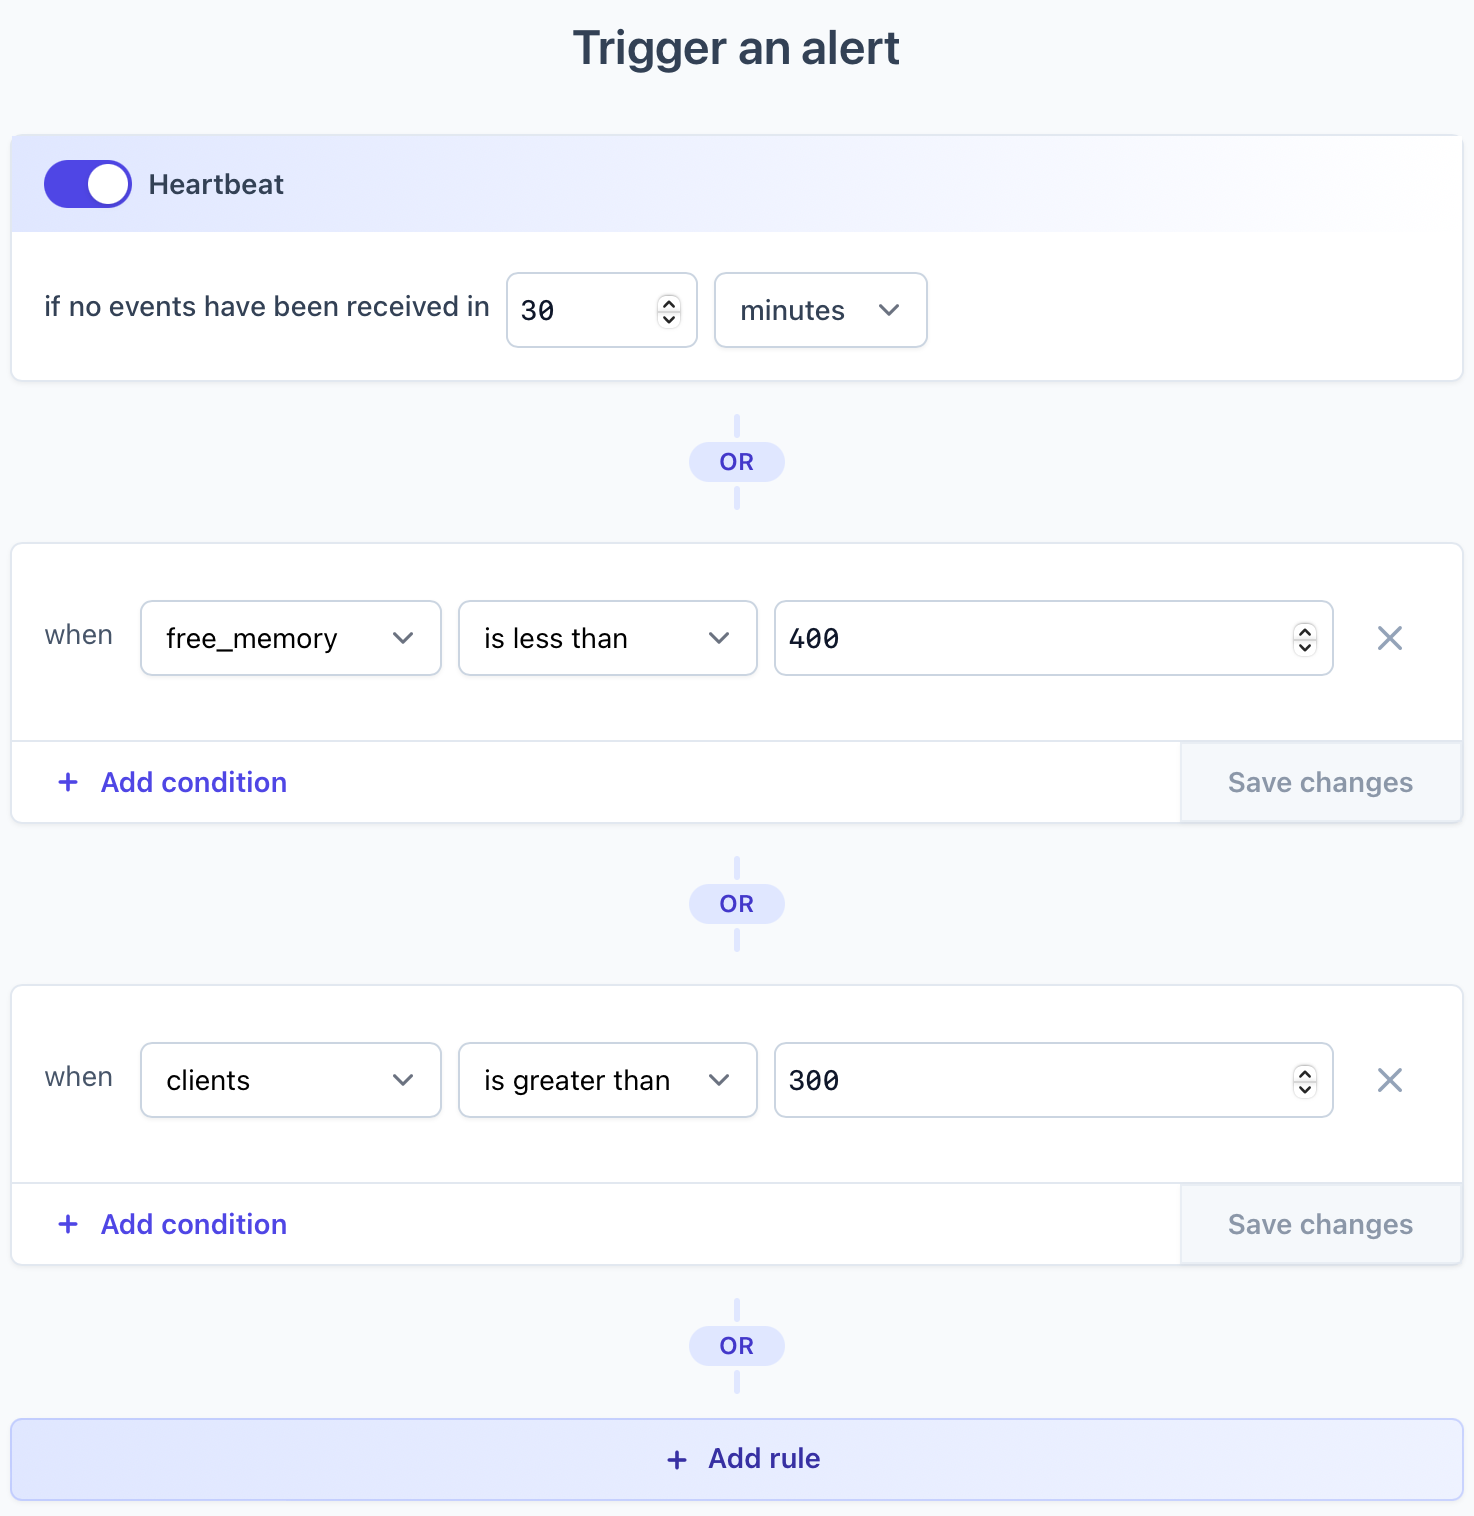
With the latest metrics flowing in periodically, we can configure alerts to notify us when something goes wrong. Let's head over to our AnomalyAlert monitor and set up some alert rules (look for the "Configure alerts" button). Since our Redis plan is capped at 500MB of memory and 400 connections, we'll set up alerts for when we're approaching those limits, as well as an alert for when we haven't received any data for 30 minutes.

Now, as soon as one of these rules is violated, we'll get a notification.